Social media analytics and automated reports that show what to post next
See what worked, then do more of it.
Social Analytics shows reach, engagement and best times per channel. Ads Analytics covers your Meta ads. Create Report turns it into a shareable report and can send it every week.
Nine dashboards and still no answer
Each channel reports in its own way, so comparing Instagram with Facebook means exporting CSVs and building a spreadsheet. By the time the monthly report is done, it is too late to change the plan.
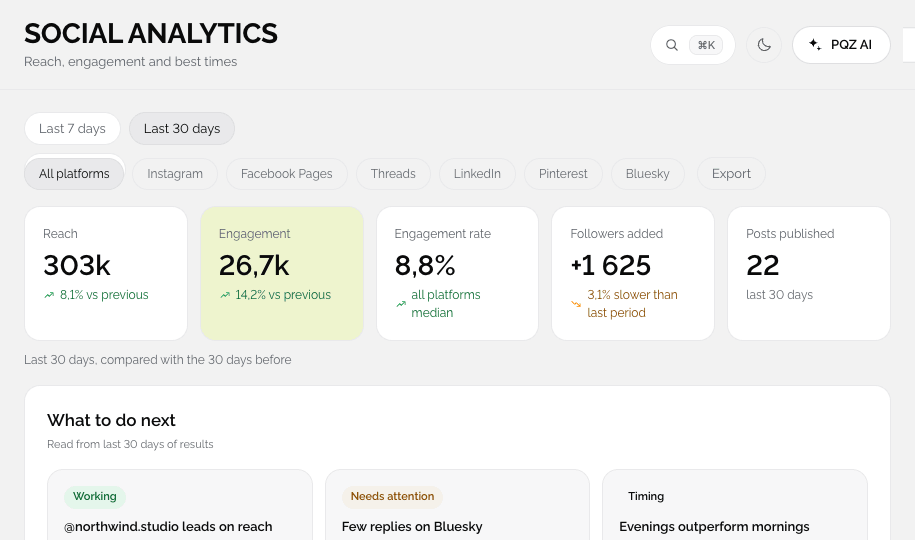
Social Analytics puts every channel side by side and points at what to do next: the formats, times and posts that worked. Content Autopilot uses the same results to pick best times, and Create Report turns the numbers into a report you can share by link.
See what is working across every channel
Reach, engagement and best times in one view
Social Analytics shows reach, engagement, followers and clicks for every connected channel, with your top posts and the times your audience is most active. Compare periods to see whether this month beat the last.

Meta ads results next to your organic posts
Spend, cost per result and return
Ads Analytics shows spend, results, cost per result and return on ad spend for your Meta campaigns across seven tabs, so you can see which ads and audiences earn their budget.

Reports that build and send themselves
Pick the metrics, set the schedule
Create Report builds a report from the metrics and channels you choose, with your logo. Save it once, then schedule it weekly or monthly for your team or your client.
From data to decision
No spreadsheets.
Connect channels
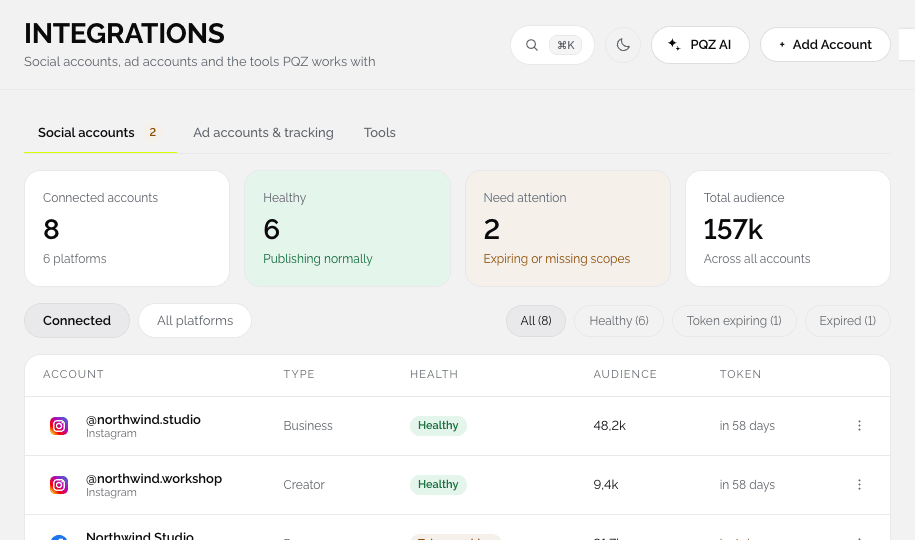
Data flows in from each channel from the day you connect it.
Read the summary
Reach, engagement, best times and top posts per channel.
Build a report
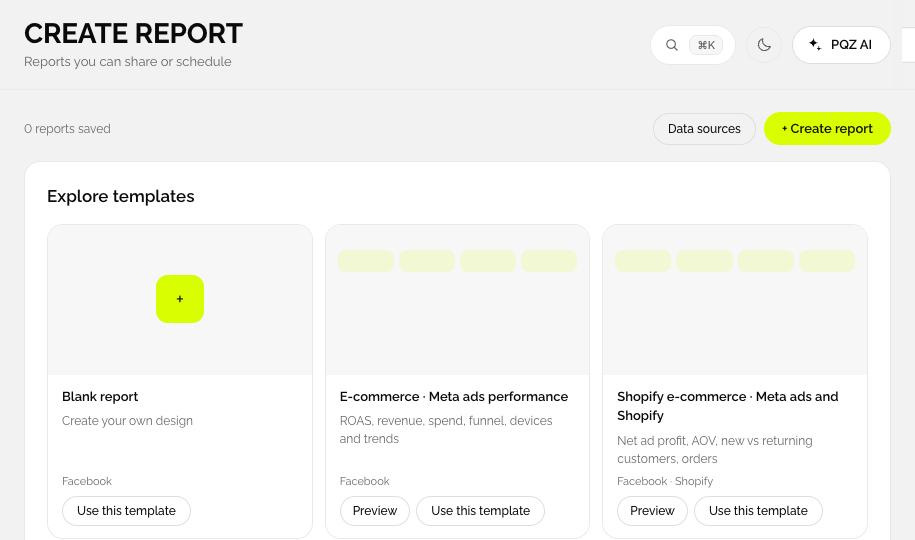
Pick a template or start blank. Share as a link or PDF.
Send it on schedule
Weekly or monthly, to your team or a client.
Every number that matters
Per channel, per format, per post.
Reach
How many people saw your posts, per channel.
Engagement
Likes, comments, shares and saves.
Best times
When your audience is active, used for scheduling.
Formats
Reels, carousels, Stories or posts: which performs.
Top posts
What to make more of next month.
Ads Analytics
Seven tabs for Meta ads: targeting, placement, creative, copy and more.
Create Report
Shareable reports from templates in a few clicks.
Scheduled reports
Sent automatically to your team or client.
Ask the AI Assistant
"What worked best last month?" gets an answer with the posts behind it.
Analytics that feed the next plan
Compare channels fairly
Social Analytics shows reach, engagement and saves side by side for every connected channel, so you can see which channel and format earn their place without exporting anything.
Best times that update themselves
PQZ reads when your audience responds and suggests best times per channel. Content Autopilot and the Content Calendar use those times when scheduling.
Ads and organic results side by side
Ads Analytics covers your Meta ads across seven tabs, from targeting and placements to creative and copy, so you can see which ads worked and relaunch them from the Bulk Ad Launcher.
Reports without the busywork
Create Report builds a report from a template in a few clicks. Share it by link, export a PDF, or schedule it weekly or monthly for your team or a client.
How teams use analytics in PQZ
Three ways to act on results.
A monthly review in ten minutes
Open Social Analytics, check top posts and formats, and adjust next month's plan.
Know which ads worked
Ads Analytics shows which creative and copy drove results, ready for Bulk Ad Launcher.
Reporting, before and after PQZ
The same month of results.